- Home
- Forex Tutorial
- Harmonic Patterns vs Fibonacci ...


✅ Introduction
Have you ever looked at a forex chart and felt like price moves follow hidden rhythms like there’s a mathematical code woven into every swing? That’s because behind the chaos, markets often move in patterns… and two of the most powerful tools for decoding those movements are Harmonic Patterns vs Fibonacci Trading. While both rely on Fibonacci ratios, they serve different purposes and require different levels of precision and analysis.
Understanding the difference matters because traders who blend or confuse these techniques often end up forcing setups that don’t exist or entering too early without proper confirmation. To trade like a pro, you must know when to simply use Fibonacci levels and when to apply detailed harmonic structures.
In this blog, we will explore
- What harmonic patterns are
- What Fibonacci trading means
- How each method works (with clear examples)
- Types of harmonic & Fibonacci strategies
- Key benefits & limitations
- When to use each
- Common mistakes traders make
- FAQs for clarity
- Final practical lessons for beginner traders
✅Definition: Simple Explanations
📐 Harmonic Patterns
Harmonic Patterns are a specific, advanced form of technical analysis that uses geometric price patterns and a confluence of multiple, precise Fibonacci ratios to predict exact market reversal points. These structured formations—like the Gartley, Bat, or Butterfly—are defined by four or five measured legs (X-A-B-C-D) that must align with strict mathematical rules. The core idea is that market movements create symmetrical structures that repeat over time.
📈 Fibonacci Trading
Fibonacci Trading, in its simpler form, involves applying the basic Fibonacci retracement and extension tools to a single price swing or trend. Traders use individual levels (e.g., 38.2%, 61.8%, 127.2%) to identify potential areas of support, resistance, or profit targets. It’s a versatile tool that can be integrated into virtually any trading strategy without the need for a complete, complex pattern to form.
✅ How It Works (With Example)
How Harmonic Patterns Work (The Bullish Gartley)
A trader spots a potential bullish Gartley pattern. They measure the price movements across four legs:
- XA Leg: An initial impulse move up.
- AB Retracement: The price pulls back, and the trader verifies it stops near the 61.8% Fibonacci retracement of XA.
- BC Retracement/Extension: The price moves up again, then pulls back, confirming a specific ratio (e.g., 78.6%) relative to the AB leg.
- CD Leg (The PRZ): The final leg moves down to a confluence zone—the Potential Reversal Zone (PRZ)—where multiple ratios converge (e.g., 78.6% of XA and 127.2% of BC).
The trader enters a long trade only when the price enters this precise PRZ, expecting a sharp reversal.
How Basic Fibonacci Trading Works
A trader identifies a clear bullish trend on the H1 chart. The price makes a strong impulse move from a low of $100 to a high of $120.
- Apply the Tool: The trader draws the Fibonacci Retracement tool from the $100 low to the $120 high.
- Identify Support: They look for potential buying opportunities at key support levels, such as the 50% or 61.8% retracement levels (which are $110 and $107.60, respectively).
- Entry and Management: The trader places a buy order at $107.60 with a stop-loss below the $100 starting point. The trade is managed based on price action at that single level, aiming for a new high or a Fibonacci extension target like 127.2% ($125.44).
✅ Types
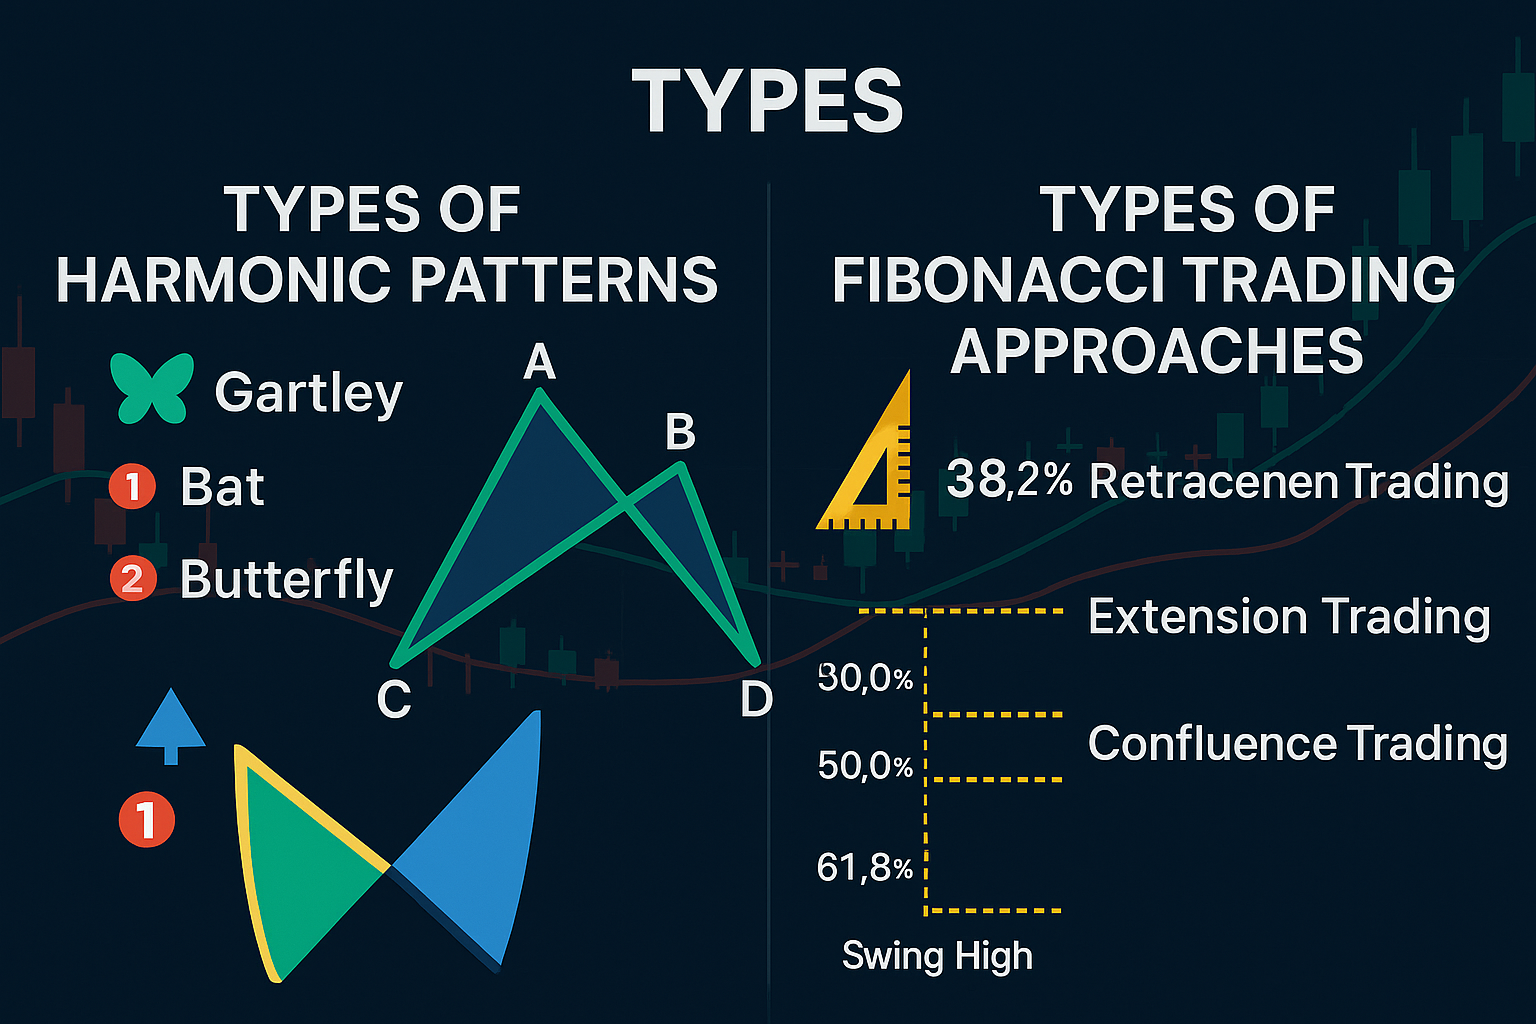
✅ Types of Harmonic Patterns
As previously noted, there are several defined patterns, each with its unique ratio requirements:
- 🦋 Butterfly: Extreme reversal pattern, point D extends past point X (e.g., 127% of XA).
- 🦇 Bat: Shorter B point retracement (38.2%-50% of XA), deep D point (88.6% of XA).
- 🦀 Crab: The most extreme, with a 161.8% extension of the XA leg, often leading to sharp reversals.
- 🦈 Shark & Cypher: Newer patterns with different structures and ratios that also identify extreme market conditions.
✅ Types of Fibonacci Trading Approaches
- 📉 Fibonacci Retracements: Used to identify potential pullbacks or corrections within an existing trend (common levels: 38.2%, 50%, 61.8%).
- 📈 Fibonacci Extensions/Projections: Used to identify profit targets once a price moves beyond a previous high or low (common levels: 127.2%, 161.8%, 261.8%).
- 🌐 Fibonacci Time Zones: An advanced, less common method attempting to predict when a reversal might occur based on the sequence.
- 📊 Fibonacci Fans/Arcs: Use diagonal lines or curved lines to predict support and resistance over time and price.
✅ Benefits
Benefits of Harmonic Patterns
- 🎯 High Precision: The confluence of multiple Fibonacci ratios in the PRZ makes for highly precise entry and exit points, which aids in managing risk.
- 🧭 Leading Indicators: They help traders anticipate market turns before they happen, allowing for early entry into new trends.
- 📉 Favorable Risk-to-Reward: Because entry points are so specific and close to the ultimate reversal point (Point D), stop-losses are tight, often resulting in excellent risk-to-reward ratios (e.g., 1:3 or higher).
- ✅ Objective Rules: The rigid mathematical rules remove a lot of subjectivity from trading decisions.
Benefits of Fibonacci Trading
- versatility Versatility and Simplicity: Easy to apply to any chart, market, or timeframe. The basic concept is simple for beginners to grasp.
- 🤝 Great Confluence Tool: Fibonacci levels work exceptionally well when combined with other indicators (e.g., a 61.8% retracement aligning with a major moving average or a supply/demand zone).
- 📈 Identifies Targets and Stops: Provides clear, statistically relevant areas to place profit targets (extensions) and stop-losses (below a key retracement level).
- 🔄 Adaptive to Trends: It adapts fluidly to current market swings and trends, making it easy to incorporate into trend-following strategies.
✅ Drawbacks / Limitations
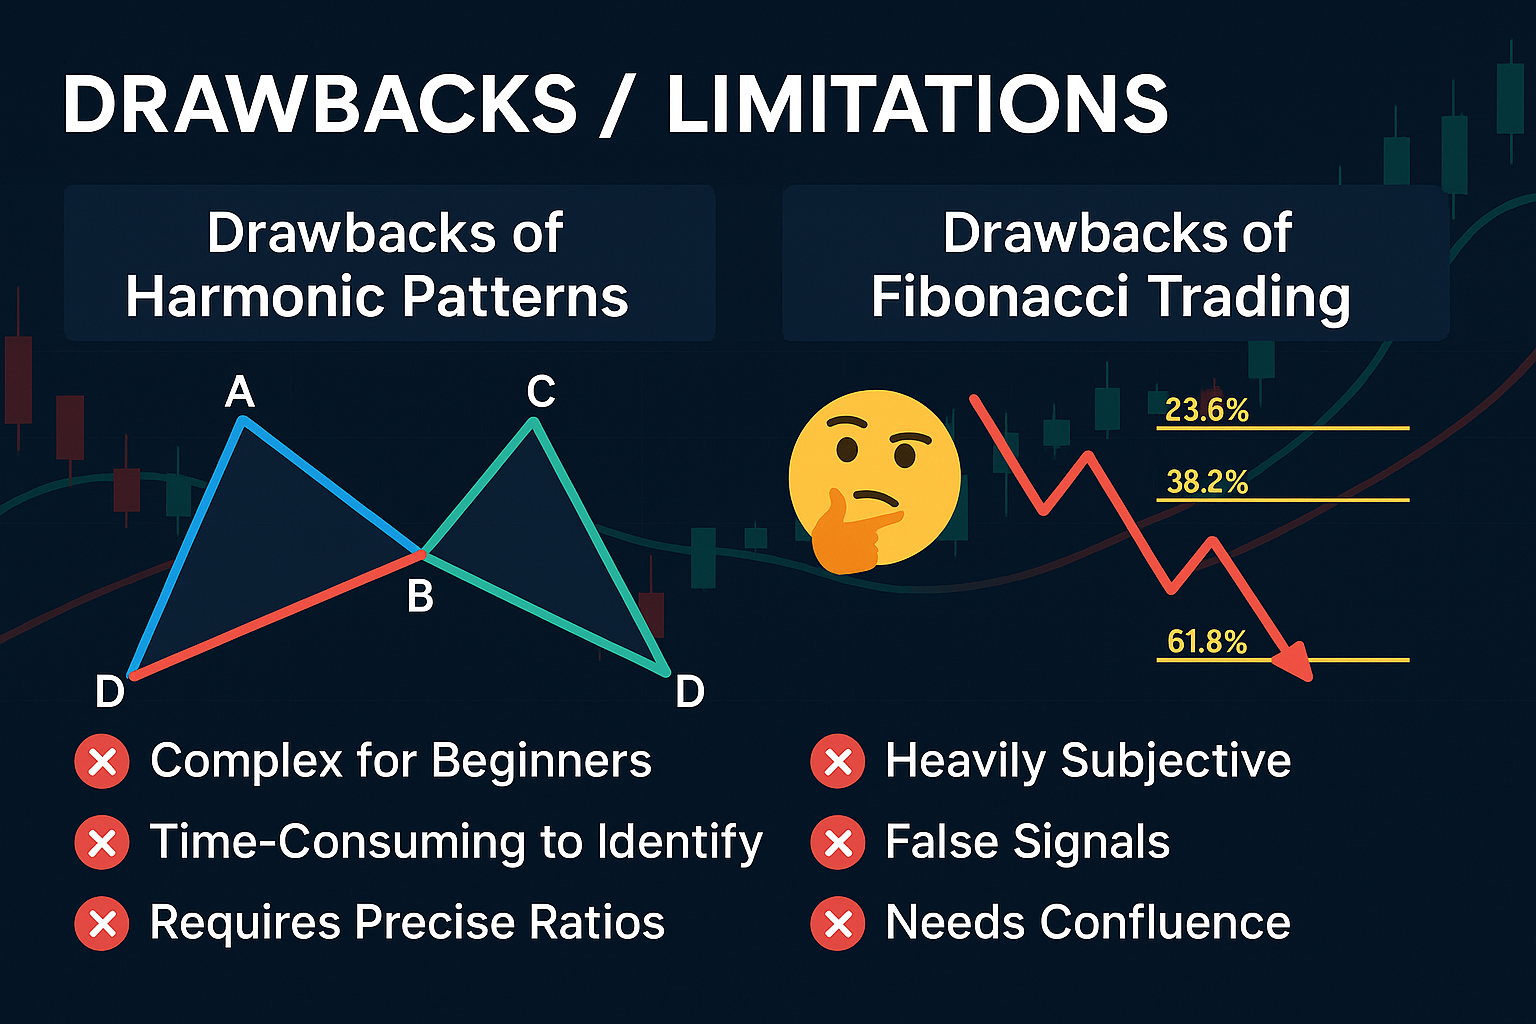
✅Drawbacks of Harmonic Patterns
- 🤯 Complexity and Learning Curve: Mastering the different patterns and their specific, strict ratio requirements takes significant time and practice.
- 🚫 Requires Exactness: If the ratios are even slightly off, the pattern is considered invalid, which can be frustrating for new traders trying to find perfect examples.
- 📉 Rarer Setups: True, perfect harmonic patterns appear less frequently than simple Fibonacci setups, requiring patience and screen time.
- 💻 Needs Specialized Software: Drawing these manually is tedious; many traders rely on automated software to identify them.
✅Drawbacks of Fibonacci Trading
- 🤷 Subjectivity in Drawing: The biggest drawback is determining where to start and end the “swing” for drawing the tool. Different traders can draw different swings and thus get different levels.
- ❌ Levels Are Not Guaranteed: Price does not always respect a Fibonacci level. A 61.8% level can be breached easily during strong momentum.
- 🧠 Can Lead to Over-analysis: There are many Fibonacci levels available (23.6, 38.2, 50, 61.8, 78.6, 127.2, 161.8, etc.), which can lead to confusion and analysis paralysis.
- 📉 Not a Standalone System: Simple Fibonacci levels work best when used as a confluence tool, not as the sole reason for taking a trade.
✅ When to Use Each
✅ Use Harmonic Patterns When
- 🧭 When Seeking Precision: Ideal when a trader wants very tight stops and precise entry points in a potential reversal zone.
- 🔄 In Mean-Reverting Markets: Works exceptionally well in markets that tend to reverse after overextending, such as certain forex pairs during specific sessions.
- 🧑💻 For Advanced Traders: Best suited for experienced traders who have mastered basic technical analysis and are ready for a more complex, rule-based approach.
✅ When to Use Fibonacci Trading
- 📊 For Trend Following: Excellent for “buying the dip” in a bull market or “selling the rally” in a bear market using retracement levels.
- 🚀 To Set Targets: The primary use for extensions is to project where a price might go once it breaks out of a range or makes a new high/low.
- 💡 For Simplicity: A great starting point for new traders due to its ease of application and visual nature.
✅ Common Mistakes
Harmonic Patterns Mistakes
- 📏 Ignoring the Rules: The absolute worst mistake is trading a “pattern” that does not meet the exact ratio requirements. Discipline is key.
- 📉 Trading without Confluence: Relying solely on the PRZ without waiting for a confirmation signal (like a specific candlestick or indicator reversal) is risky.
- 🧠 Forcing the Pattern: Trying to make a pattern fit the rules when it clearly doesn’t is a common cognitive bias to avoid.
Fibonacci Trading Mistakes
- ❌ Drawing the Wrong Swing: Incorrectly identifying the start and end of the price swing is the most frequent error, rendering the levels useless.
- 🤷 Trading Every Level: Don’t assume every 38.2% or 61.8% level is a perfect entry point. Wait for price action confirmation.
- 🛡️ Forgetting Risk Management: Assuming that because price should reverse at a 61.8% level, you don’t need a stop-loss is a recipe for disaster.
✅ FAQs Section
Q: Which is more profitable, harmonic patterns or basic Fibonacci trading?
A: Profitability depends on the trader’s skill, discipline, and risk management. Harmonic patterns offer tighter risk-to-reward ratios but appear less frequently, while basic Fibonacci trading is more versatile for trend trading.
Q: Do I need to be a math expert to use these strategies?
A: No. While they are based on mathematical principles, charting software automatically calculates and draws the levels for you. Your job is to apply them correctly and interpret the price action.
Q: What are key keywords for SEO?
A: Harmonic patterns, Fibonacci trading, Gartley pattern, Fibonacci retracement, technical analysis, forex strategies, trading for beginners, risk management, and chart patterns.
Q: Can I use both together?
A: Yes, in a sense. Harmonic patterns are an advanced application of Fibonacci ratios. Using basic Fibonacci levels to confirm a leg of a harmonic pattern or to set targets for a harmonic trade is a powerful combination.
✅ Final Thoughts
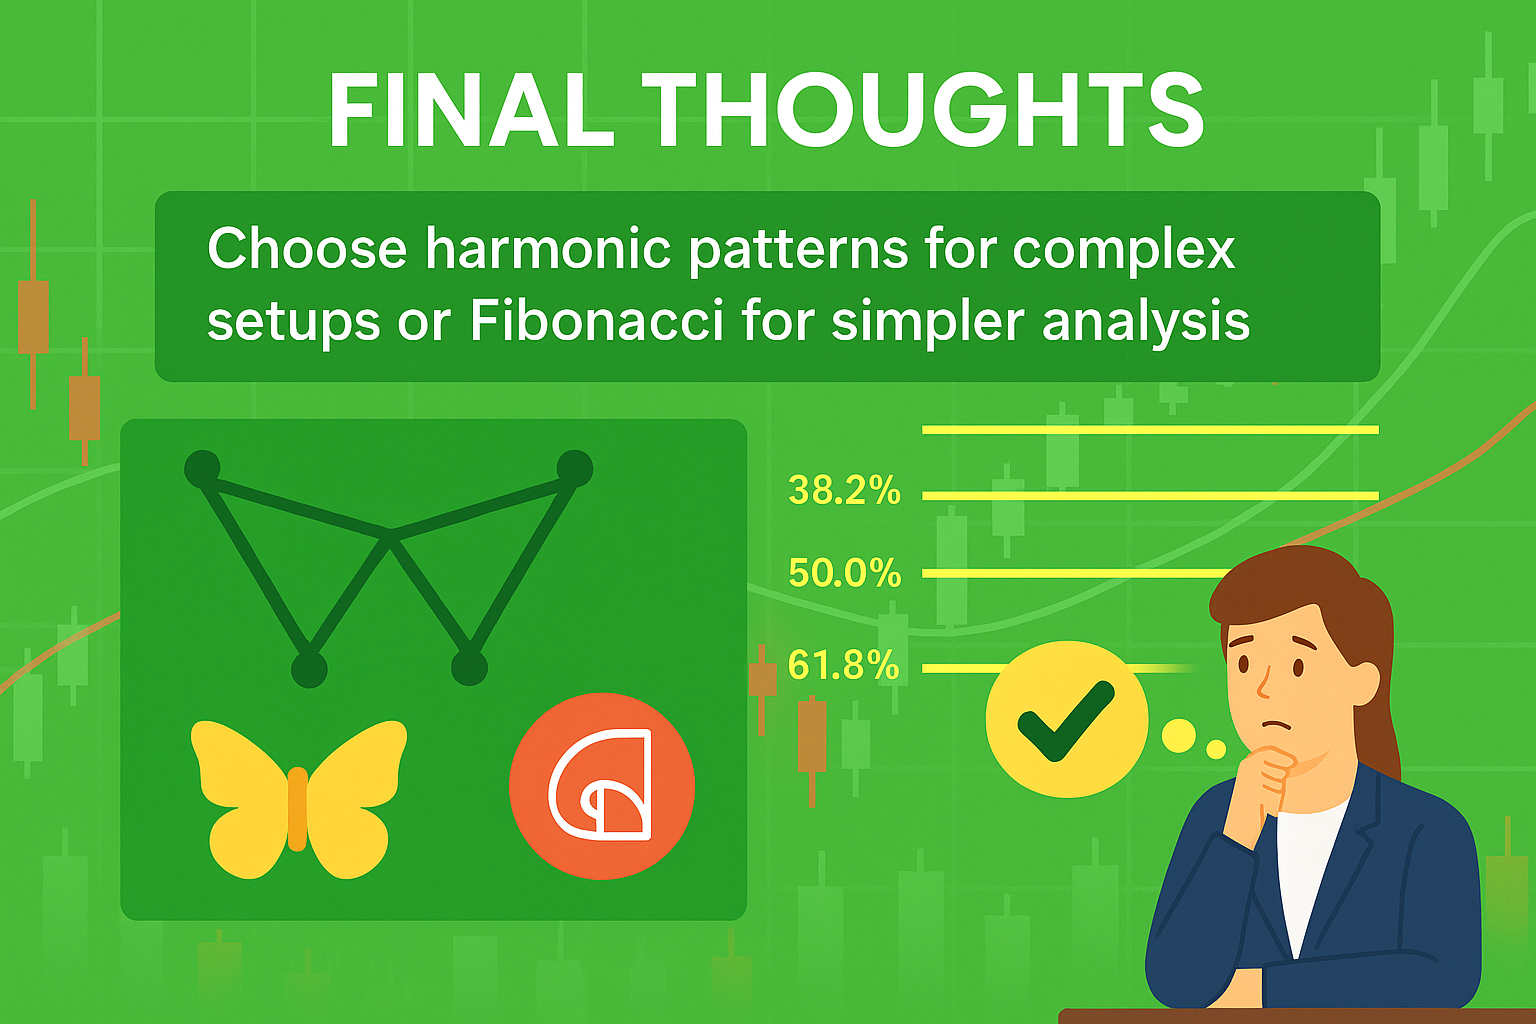
The choice between the structured geometry of harmonic patterns and the fluid versatility of basic Fibonacci trading boils down to your preference for complexity versus simplicity. Harmonic patterns offer high-precision, high-reward opportunities but demand patience and deep knowledge. Basic Fibonacci trading provides an easily applicable tool that can enhance almost any existing strategy.
For learners, it is wise to start by mastering the simple application of Fibonacci retracements and extensions to understand market rhythm and flow. Once comfortable with these foundations and sound risk management, you can explore the intricate world of harmonic patterns. Both strategies provide a powerful, objective lens through which to view the markets, reinforcing the idea that structure and mathematics play a significant role in price movements.
Sources
https://en.wikipedia.org/wiki/Chart_pattern
https://en.wikipedia.org/wiki/Fibonacci_retracement


No Comments